


In relation to the USA, the EU and Ukraine, negative assessments prevail among respondents, the share of which has increased slightly in recent months. Young people still treat these countries noticeably better. At the same time, more than half of the respondents believe that Russia still needs to establish relations with Western countries. Positive assessments prevail in relation to China and Iran. Respondents consider Belarus, China and India to be close friends of Russia, which has pushed Kazakhstan and Armenia, the United States, Great Britain and Germany are the most hostile, the perception of the latter as unfriendly has increased significantly over the past year.
Respondents were asked to assess their attitude towards countries and associations from the following list: USA, EU, Ukraine, China, Iran. A negative attitude still prevails in relation to Western countries and Ukraine. The respondents have the best attitude towards China and Iran, while speaking about the attitude towards the latter, there are many undecided respondents – 22%.

The attitude of Russians towards the United States remains mostly negative and has slightly deteriorated since February of this year. The share of positive ratings in May was 12% (in February — 14%) of respondents, negative — 77% (in February – 73%). As before, the young groups of the population are best treated in the USA: 25% of respondents aged 18-24 and 19% in the 25-39 age group. The older groups are the worst: 11% of respondents aged 40-54 are positive, 79% are negative; 7% of respondents aged 55 and older are positive, 85% are negative.
Attitude to the US
| Positive |
| Negative |
| Difficult to answer |
| 04.1990 | 11.1991 | 08.1992 | 04.1993 | 03.1997 | 12.1998 | 03.1999 | 04.1999 | 05.1999 | 08.1999 | 09.1999 | 11.1999 | 12.1999 | 02.2000 | 05.2000 | 07.2000 | 02.2001 | 05.2001 | 09.2001 | 10.2001 | 11.2001 | 12.2001 | 01.2002 | 03.2002 | 04.2002 | 05.2002 | 06.2002 | 07.2002 | 08.2002 | 09.2002 | 10.2002 | 11.2002 | 01.2003 | 03.2003 | 03.2003 | 04.2003 | 05.2003 | 05.2003 | 06.2003 | 07.2003 | 08.2003 | 09.2003 | 10.2003 | 11.2003 | 12.2003 | 01.2004 | 02.2004 | 03.2004 | 04.2004 | 05.2004 | 06.2004 | 07.2004 | 08.2004 | 09.2004 | 10.2004 | 11.2004 | 12.2004 | 01.2005 | 02.2005 | 03.2005 | 04.2005 | 05.2005 | 06.2005 | 07.2005 | 08.2005 | 09.2005 | 10.2005 | 11.2005 | 12.2005 | 01.2006 | 02.2006 | 03.2006 | 04.2006 | 05.2006 | 06.2006 | 07.2006 | 08.2006 | 09.2006 | 10.2006 | 11.2006 | 12.2006 | 01.2007 | 02.2007 | 03.2007 | 04.2007 | 05.2007 | 06.2007 | 07.2007 | 08.2007 | 10.2007 | 11.2007 | 12.2007 | 01.2008 | 02.2008 | 03.2008 | 05.2008 | 07.2008 | 09.2008 | 11.2008 | 01.2009 | 03.2009 | 05.2009 | 07.2009 | 09.2009 | 01.2010 | 03.2010 | 05.2010 | 07.2010 | 09.2010 | 11.2010 | 01.2011 | 03.2011 | 07.2011 | 09.2011 | 11.2011 | 01.2012 | 03.2012 | 05.2012 | 07.2012 | 09.2012 | 11.2012 | 01.2013 | 03.2013 | 05.2013 | 07.2013 | 09.2013 | 12.2013 | 01.2014 | 05.2014 | 07.2014 | 09.2014 | 11.2014 | 01.2015 | 03.2015 | 05.2015 | 07.2015 | 09.2015 | 11.2015 | 01.2016 | 03.2016 | 05.2016 | 07.2016 | 09.2016 | 11.2016 | 01.2017 | 03.2017 | 05.2017 | 08.2017 | 09.2017 | 12.2017 | 01.2018 | 03.2018 | 05.2018 | 07.2018 | 09.2018 | 11.2018 | 02.2019 | 05.2019 | 08.2019 | 11.2019 | 01.2020 | 08.2020 | 11.2020 | 01.2021 | 03.2021 | 05.2021 | 08.2021 | 11.2021 | 02.2022 | 03.2022 | 05.2022 | 08.2022 | 11.2022 | 02.2023 | 05.2023 | 08.2023 | 09.2023 | 10.2023 | 05.2024 | 09.2024 | 02.2025 | 05.2025 | 08.2025 | 10.2025 | 01.2026 | 03.2026 | 05.2026 |
| 75 | 80 | 74 | 72 | 72 | 67 | 38 | 33 | 32 | 49 | 60 | 54 | 60 | 67 | 68 | 69 | 59 | 69 | 70 | 60 | 68 | 65 | 68 | 48 | 59 | 61 | 65 | 69 | 67 | 60 | 69 | 61 | 53 | 48 | 38 | 27 | 45 | 46 | 46 | 56 | 59 | 47 | 64 | 59 | 59 | 54 | 65 | 56 | 53 | 53 | 56 | 57 | 67 | 62 | 62 | 66 | 58 | 61 | 60 | 60 | 63 | 60 | 63 | 66 | 63 | 59 | 61 | 63 | 57 | 57 | 52 | 50 | 53 | 45 | 51 | 54 | 55 | 58 | 50 | 56 | 50 | 55 | 45 | 44 | 43 | 45 | 48 | 52 | 47 | 48 | 54 | 47 | 51 | 49 | 48 | 51 | 43 | 23 | 33 | 38 | 46 | 36 | 47 | 53 | 54 | 53 | 60 | 60 | 56 | 62 | 60 | 54 | 59 | 60 | 64 | 45 | 51 | 54 | 56 | 46 | 53 | 55 | 48 | 51 | 53 | 41 | 48 | 43 | 18 | 17 | 17 | 18 | 12 | 19 | 16 | 19 | 21 | 21 | 23 | 25 | 19 | 25 | 23 | 28 | 37 | 37 | 24 | 35 | 31 | 24 | 26 | 25 | 20 | 42 | 33 | 31 | 34 | 31 | 42 | 47 | 42 | 42 | 35 | 40 | 40 | 31 | 39 | 45 | 31 | 17 | 14 | 19 | 18 | 14 | 12 | 22 | 18 | 16 | 19 | 16 | 30 | 37 | 48 | 34 | 33 | 20 | 26 |
| 7 | 6 | 8 | 7 | 18 | 23 | 49 | 53 | 54 | 33 | 25 | 31 | 28 | 22 | 21 | 23 | 27 | 22 | 20 | 27 | 22 | 24 | 20 | 41 | 34 | 28 | 26 | 19 | 22 | 29 | 24 | 29 | 38 | 40 | 55 | 66 | 43 | 44 | 42 | 38 | 30 | 43 | 28 | 33 | 30 | 36 | 29 | 36 | 36 | 37 | 35 | 35 | 26 | 31 | 31 | 29 | 34 | 32 | 31 | 32 | 29 | 31 | 29 | 26 | 26 | 30 | 30 | 30 | 32 | 32 | 37 | 39 | 39 | 44 | 39 | 36 | 34 | 33 | 39 | 32 | 36 | 35 | 45 | 47 | 48 | 43 | 41 | 38 | 39 | 41 | 35 | 42 | 39 | 37 | 40 | 37 | 46 | 67 | 51 | 49 | 40 | 50 | 40 | 33 | 31 | 34 | 27 | 27 | 29 | 26 | 27 | 33 | 29 | 27 | 23 | 40 | 35 | 32 | 32 | 38 | 34 | 25 | 39 | 38 | 36 | 49 | 37 | 44 | 71 | 74 | 73 | 73 | 81 | 73 | 73 | 70 | 68 | 70 | 65 | 64 | 70 | 65 | 65 | 56 | 49 | 51 | 61 | 51 | 59 | 60 | 52 | 56 | 69 | 40 | 55 | 57 | 56 | 43 | 44 | 40 | 46 | 46 | 51 | 43 | 42 | 54 | 47 | 42 | 55 | 72 | 75 | 71 | 73 | 73 | 77 | 61 | 70 | 68 | 70 | 72 | 51 | 47 | 30 | 45 | 45 | 57 | 56 |
| 19 | 14 | 20 | 22 | 10 | 10 | 13 | 14 | 15 | 18 | 15 | 15 | 13 | 12 | 11 | 8 | 13 | 9 | 10 | 12 | 10 | 11 | 12 | 10 | 8 | 11 | 10 | 13 | 11 | 10 | 7 | 10 | 9 | 12 | 7 | 7 | 12 | 10 | 13 | 6 | 11 | 11 | 9 | 9 | 11 | 10 | 7 | 8 | 11 | 10 | 8 | 9 | 7 | 7 | 7 | 5 | 8 | 7 | 9 | 8 | 8 | 9 | 8 | 8 | 11 | 10 | 9 | 7 | 11 | 12 | 12 | 12 | 8 | 11 | 9 | 11 | 11 | 10 | 11 | 12 | 14 | 10 | 11 | 9 | 10 | 12 | 12 | 10 | 14 | 11 | 11 | 11 | 15 | 12 | 12 | 11 | 10 | 15 | 13 | 14 | 14 | 14 | 14 | 15 | 14 | 14 | 13 | 16 | 12 | 13 | 13 | 12 | 13 | 13 | 15 | 15 | 14 | 12 | 15 | 13 | 17 | 13 | 11 | 11 | 11 | 15 | 13 | 11 | 9 | 10 | 9 | 7 | 8 | 12 | 11 | 12 | 10 | 13 | 10 | 11 | 9 | 13 | 16 | 14 | 12 | 15 | 14 | 11 | 16 | 22 | 19 | 11 | 18 | 12 | 12 | 11 | 16 | 14 | 13 | 12 | 12 | 14 | 17 | 18 | 15 | 14 | 13 | 13 | 11 | 11 | 10 | 9 | 13 | 11 | 17 | 12 | 16 | 12 | 13 | 20 | 16 | 22 | 21 | 22 | 23 | 18 |

The attitude towards the European Union also continues to be negative. 16% (in February — 18%) of respondents feel good about the EU, 72% feel bad about it (in February — 69%). The age distribution repeats the nature of the attitude towards the United States. Young people aged 18-24 have the best attitude towards the European Union (30% positive, 56% negative), the worst — respondents 55 years and older (9% positive, 81% negative).
Attitude to the EU
| Positive |
| Negative |
| Difficult to answer |
| 12.2003 | 01.2004 | 02.2004 | 08.2004 | 01.2005 | 02.2005 | 03.2005 | 04.2005 | 05.2005 | 06.2005 | 07.2005 | 08.2005 | 09.2005 | 10.2005 | 11.2005 | 12.2005 | 01.2006 | 02.2006 | 03.2006 | 04.2006 | 05.2006 | 06.2006 | 07.2006 | 08.2006 | 09.2006 | 10.2006 | 11.2006 | 12.2006 | 01.2007 | 02.2007 | 03.2007 | 04.2007 | 05.2007 | 06.2007 | 07.2007 | 08.2007 | 10.2007 | 11.2007 | 12.2007 | 01.2008 | 02.2008 | 07.2008 | 09.2008 | 11.2008 | 01.2009 | 03.2009 | 05.2009 | 07.2009 | 09.2009 | 01.2010 | 03.2010 | 05.2010 | 07.2010 | 09.2010 | 11.2010 | 01.2011 | 03.2011 | 05.2011 | 07.2011 | 09.2011 | 11.2011 | 01.2012 | 03.2012 | 05.2012 | 07.2012 | 09.2012 | 11.2012 | 01.2013 | 03.2013 | 05.2013 | 07.2013 | 09.2013 | 12.2013 | 01.2014 | 03.2014 | 04.2014 | 05.2014 | 07.2014 | 09.2014 | 11.2014 | 01.2015 | 03.2015 | 05.2015 | 07.2015 | 09.2015 | 11.2015 | 01.2016 | 03.2016 | 05.2016 | 07.2016 | 09.2016 | 11.2016 | 01.2017 | 03.2017 | 05.2017 | 08.2017 | 09.2017 | 12.2017 | 01.2018 | 03.2018 | 05.2018 | 07.2018 | 09.2018 | 11.2018 | 02.2019 | 05.2019 | 08.2019 | 11.2019 | 01.2020 | 08.2020 | 11.2020 | 01.2021 | 05.2021 | 08.2021 | 11.2021 | 02.2022 | 03.2022 | 05.2022 | 08.2022 | 11.2022 | 02.2023 | 05.2023 | 08.2023 | 09.2023 | 10.2023 | 05.2024 | 09.2024 | 02.2025 | 05.2025 | 10.2025 | 01.2026 | 05.2026 |
| 72 | 67 | 76 | 77 | 74 | 69 | 77 | 73 | 71 | 73 | 73 | 69 | 66 | 70 | 73 | 68 | 66 | 61 | 66 | 67 | 62 | 70 | 68 | 69 | 69 | 69 | 71 | 67 | 73 | 64 | 65 | 64 | 61 | 66 | 66 | 60 | 61 | 67 | 64 | 70 | 60 | 60 | 45 | 53 | 55 | 62 | 57 | 61 | 63 | 64 | 62 | 68 | 66 | 67 | 72 | 69 | 62 | 63 | 66 | 67 | 71 | 56 | 60 | 64 | 65 | 64 | 60 | 64 | 59 | 61 | 64 | 56 | 54 | 51 | 45 | 33 | 25 | 27 | 19 | 25 | 20 | 25 | 26 | 26 | 25 | 29 | 27 | 28 | 25 | 29 | 27 | 30 | 40 | 35 | 27 | 38 | 34 | 28 | 32 | 26 | 27 | 42 | 39 | 36 | 42 | 38 | 49 | 52 | 49 | 48 | 47 | 45 | 38 | 46 | 48 | 37 | 21 | 16 | 23 | 21 | 18 | 16 | 23 | 26 | 18 | 19 | 16 | 21 | 21 | 23 | 21 | 18 |
| 11 | 17 | 13 | 13 | 14 | 18 | 14 | 15 | 15 | 13 | 15 | 13 | 16 | 15 | 13 | 17 | 15 | 20 | 17 | 18 | 20 | 14 | 16 | 14 | 17 | 16 | 12 | 15 | 15 | 19 | 20 | 19 | 20 | 19 | 20 | 21 | 22 | 16 | 21 | 17 | 20 | 25 | 39 | 27 | 27 | 20 | 23 | 22 | 19 | 19 | 21 | 16 | 17 | 16 | 14 | 16 | 22 | 21 | 19 | 18 | 14 | 25 | 20 | 18 | 20 | 18 | 23 | 21 | 25 | 23 | 24 | 29 | 28 | 34 | 41 | 53 | 60 | 60 | 68 | 63 | 71 | 64 | 59 | 62 | 60 | 60 | 58 | 60 | 62 | 61 | 58 | 53 | 47 | 53 | 55 | 47 | 54 | 54 | 46 | 53 | 55 | 38 | 45 | 49 | 45 | 44 | 34 | 33 | 36 | 39 | 37 | 37 | 45 | 39 | 38 | 48 | 67 | 69 | 65 | 68 | 69 | 72 | 59 | 59 | 64 | 70 | 71 | 61 | 64 | 58 | 58 | 64 |
| 17 | 16 | 11 | 11 | 12 | 13 | 10 | 12 | 15 | 14 | 12 | 17 | 17 | 15 | 14 | 15 | 20 | 20 | 17 | 15 | 18 | 15 | 16 | 17 | 14 | 15 | 17 | 18 | 13 | 18 | 15 | 17 | 20 | 15 | 14 | 18 | 17 | 17 | 15 | 13 | 20 | 15 | 16 | 20 | 18 | 17 | 20 | 17 | 19 | 18 | 17 | 17 | 17 | 17 | 14 | 15 | 17 | 16 | 16 | 16 | 15 | 19 | 20 | 17 | 15 | 19 | 17 | 15 | 17 | 17 | 14 | 15 | 18 | 15 | 14 | 15 | 15 | 14 | 13 | 12 | 9 | 11 | 16 | 13 | 14 | 11 | 14 | 12 | 14 | 10 | 15 | 16 | 14 | 12 | 18 | 15 | 13 | 18 | 22 | 21 | 18 | 20 | 15 | 15 | 13 | 19 | 17 | 15 | 15 | 13 | 17 | 17 | 17 | 15 | 14 | 15 | 12 | 15 | 12 | 11 | 13 | 12 | 18 | 16 | 19 | 12 | 13 | 18 | 15 | 19 | 21 | 18 |

In May, the negative attitude towards Ukraine also increased: 15% of respondents treat this country well (in February – 17%), 74% — poorly (in February – 69%). In relation to Ukraine, a more positive attitude prevails in the age group of 18-24 years and 25-39 years: about 20% are well treated. Negative assessments prevail among respondents 55 years and older: 79% of such in this group.
Attitude to Ukraine
| Positive |
| Negative |
| Difficult to answer |
| 12.1998 | 12.1999 | 07.2000 | 07.2001 | 10.2001 | 12.2001 | 10.2002 | 07.2003 | 10.2003 | 02.2004 | 08.2004 | 11.2004 | 01.2005 | 02.2005 | 03.2005 | 04.2005 | 05.2005 | 06.2005 | 07.2005 | 08.2005 | 09.2005 | 10.2005 | 11.2005 | 12.2005 | 01.2006 | 02.2006 | 03.2006 | 04.2006 | 05.2006 | 06.2006 | 07.2006 | 08.2006 | 10.2006 | 11.2006 | 12.2006 | 01.2007 | 02.2007 | 03.2007 | 04.2007 | 05.2007 | 06.2007 | 07.2007 | 08.2007 | 10.2007 | 11.2007 | 12.2007 | 01.2008 | 02.2008 | 03.2008 | 07.2008 | 09.2008 | 11.2008 | 01.2009 | 03.2009 | 05.2009 | 07.2009 | 09.2009 | 01.2010 | 03.2010 | 05.2010 | 07.2010 | 09.2010 | 11.2010 | 01.2011 | 04.2011 | 05.2011 | 07.2011 | 09.2011 | 11.2011 | 01.2012 | 03.2012 | 05.2012 | 07.2012 | 09.2012 | 11.2012 | 01.2013 | 03.2013 | 05.2013 | 07.2013 | 09.2013 | 12.2013 | 01.2014 | 03.2014 | 04.2014 | 05.2014 | 07.2014 | 09.2014 | 11.2014 | 01.2015 | 03.2015 | 05.2015 | 07.2015 | 09.2015 | 11.2015 | 01.2016 | 03.2016 | 05.2016 | 05.2016 | 07.2016 | 09.2016 | 11.2016 | 01.2017 | 03.2017 | 05.2017 | 09.2017 | 12.2017 | 01.2018 | 03.2018 | 07.2018 | 09.2018 | 11.2018 | 02.2019 | 05.2019 | 09.2019 | 01.2020 | 08.2020 | 02.2021 | 03.2021 | 05.2021 | 08.2021 | 11.2021 | 02.2022 | 03.2022 | 05.2022 | 08.2022 | 11.2022 | 02.2023 | 05.2023 | 08.2023 | 09.2023 | 10.2023 | 05.2024 | 09.2024 | 02.2025 | 05.2025 | 10.2025 | 01.2026 |
| 79 | 78 | 71 | 71 | 54 | 71 | 64 | 78 | 71 | 67 | 76 | 79 | 74 | 72 | 71 | 68 | 72 | 69 | 67 | 71 | 63 | 65 | 68 | 60 | 54 | 50 | 53 | 56 | 55 | 56 | 60 | 68 | 61 | 66 | 64 | 67 | 61 | 58 | 62 | 48 | 55 | 62 | 58 | 59 | 65 | 57 | 59 | 50 | 55 | 52 | 37 | 34 | 29 | 41 | 34 | 44 | 46 | 52 | 60 | 66 | 70 | 67 | 73 | 72 | 70 | 65 | 65 | 68 | 66 | 64 | 65 | 66 | 71 | 74 | 69 | 73 | 69 | 72 | 77 | 69 | 65 | 65 | 63 | 52 | 35 | 33 | 32 | 29 | 24 | 31 | 26 | 29 | 33 | 27 | 28 | 25 | 26 | 39 | 31 | 27 | 34 | 34 | 33 | 26 | 32 | 28 | 35 | 33 | 36 | 33 | 28 | 34 | 37 | 56 | 41 | 48 | 55 | 50 | 33 | 39 | 45 | 35 | 30 | 23 | 23 | 20 | 17 | 15 | 20 | 25 | 17 | 16 | 14 | 16 | 14 | 20 | 16 |
| 14 | 15 | 23 | 23 | 35 | 23 | 27 | 17 | 21 | 25 | 20 | 16 | 18 | 22 | 22 | 23 | 20 | 24 | 26 | 21 | 28 | 25 | 24 | 29 | 34 | 40 | 37 | 35 | 35 | 33 | 30 | 24 | 31 | 24 | 27 | 24 | 29 | 32 | 29 | 42 | 33 | 28 | 30 | 30 | 25 | 31 | 30 | 36 | 33 | 37 | 53 | 53 | 62 | 49 | 56 | 47 | 44 | 37 | 28 | 23 | 21 | 21 | 19 | 19 | 20 | 27 | 26 | 23 | 21 | 24 | 24 | 24 | 22 | 16 | 22 | 18 | 22 | 18 | 18 | 23 | 24 | 26 | 25 | 37 | 49 | 54 | 55 | 60 | 63 | 56 | 60 | 60 | 56 | 63 | 59 | 64 | 63 | 47 | 58 | 56 | 51 | 54 | 56 | 59 | 53 | 56 | 47 | 45 | 49 | 56 | 61 | 56 | 49 | 31 | 47 | 43 | 31 | 35 | 55 | 49 | 43 | 52 | 57 | 66 | 66 | 70 | 69 | 74 | 65 | 61 | 66 | 72 | 74 | 68 | 74 | 63 | 64 |
| 7 | 8 | 6 | 6 | 11 | 7 | 9 | 5 | 8 | 7 | 5 | 5 | 8 | 7 | 8 | 10 | 8 | 7 | 7 | 8 | 9 | 10 | 9 | 11 | 12 | 10 | 10 | 10 | 10 | 11 | 10 | 8 | 9 | 9 | 9 | 8 | 11 | 11 | 9 | 10 | 13 | 10 | 12 | 11 | 9 | 11 | 11 | 14 | 13 | 11 | 10 | 13 | 10 | 9 | 11 | 10 | 10 | 11 | 13 | 11 | 9 | 12 | 8 | 9 | 11 | 8 | 9 | 9 | 13 | 12 | 11 | 10 | 7 | 10 | 9 | 9 | 9 | 9 | 6 | 8 | 12 | 9 | 12 | 11 | 17 | 13 | 13 | 12 | 13 | 13 | 14 | 11 | 11 | 10 | 14 | 11 | 12 | 13 | 11 | 17 | 16 | 13 | 11 | 15 | 15 | 17 | 18 | 12 | 15 | 12 | 11 | 10 | 14 | 13 | 11 | 8 | 13 | 15 | 13 | 12 | 12 | 13 | 13 | 11 | 11 | 10 | 14 | 11 | 15 | 14 | 17 | 12 | 12 | 16 | 13 | 18 | 20 |

The attitude towards China remains positive: 87% are good, 6% are bad. No major changes were recorded compared to the previous measurement.

Compared to July 2015, the attitude of respondents to Iran has significantly improved: if 43% treated this country well for 8 years, 25% treated it badly, then this year – 69% and 9%, respectively. Respondents from the age groups of 40-54 years and 55 years and older (72% each) expressed positive assessments more often than the rest, less often – 18-24 years and 25-39 years (63% each).


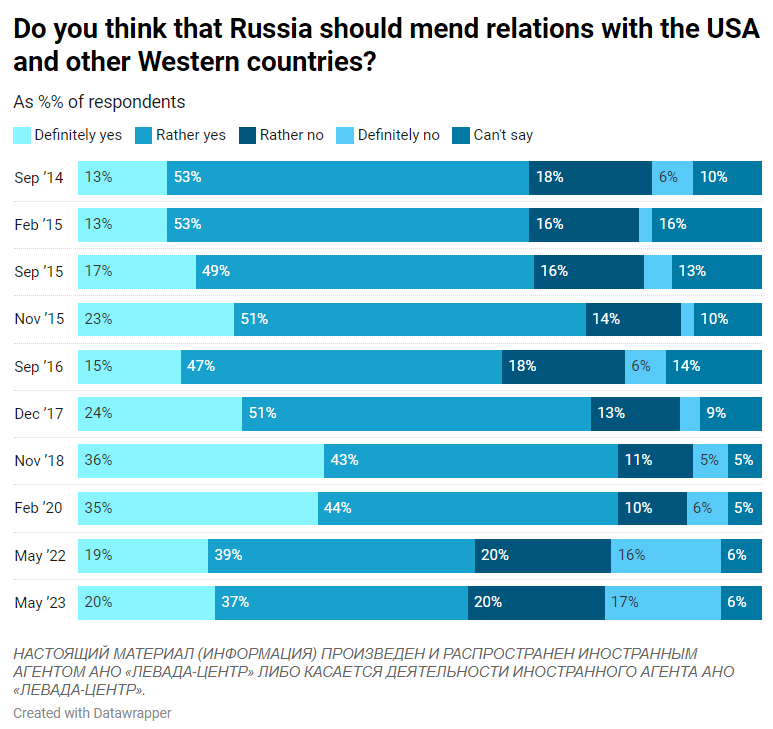
During the year, the ratio has not changed on the question of whether the Russian Federation needs to establish relations with the West: 57% of respondents support this, 37% are against it. The highest support for such a course is represented among respondents aged 25-39 – 61%.
Russians continue to consider Belarus the most friendly country: 77% hold this opinion (in 2022 – 72%). The second place is steadily occupied by China: 58% consider it friendly (in 2022 – 50%). India came in third place, showing significant growth — from 21% to 31% and overtaking Kazakhstan: 26% of respondents see it as friendly (in 2022 – 28%).

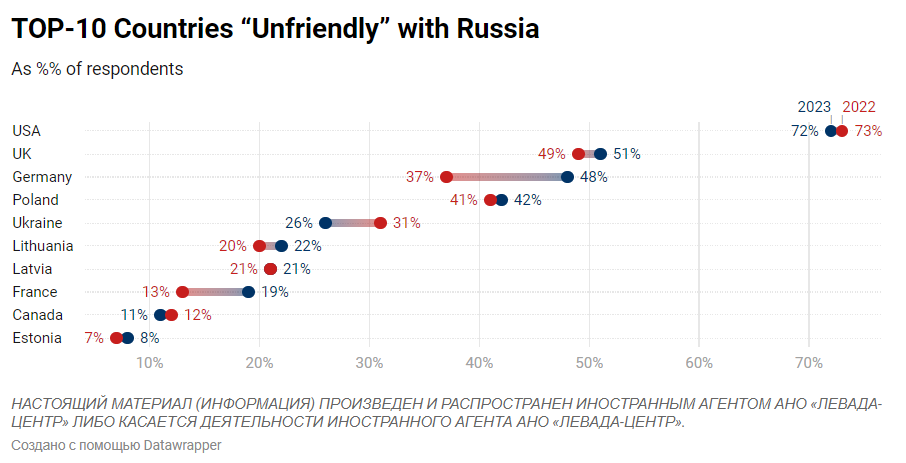
Respondents continue to consider the United States to be the main unfriendly country for Russia: 72% hold this opinion (in 2022 — 73%). The United States is followed by the United Kingdom, which 51% of respondents began to perceive as unfriendly (in 2022 — 49%), Germany — 48% (in 2022 — 37%), Poland — 42% (in 2022 — 41%). In addition, the perception of France as unfriendly has significantly increased – from 13% to 19%, and the corresponding attitude towards Ukraine has decreased – from 31% to 26%.
METHODOLOGY
The All-Russian Levada Center survey was conducted on May 25 — 31, 2023 on a representative All-Russian sample of urban and rural population of 1,603 people aged 18 years and older in 137 localities, 50 subjects of the Russian Federation. The study is conducted at the respondent’s home by a personal interview method. The distribution of responses is given as a percentage of the total number.
The statistical error in the sample of 1600 people (with a probability of 0.95) does not exceed:
3.4% for indicators close to 50%
2.9% for indicators close to 25% / 75%
2.0% for indicators close to 10% / 90%
1.5% for indicators close to 5% / 95%
ANO “Levada Center” is included in the register of non-profit organizations performing the functions of a foreign agent.