


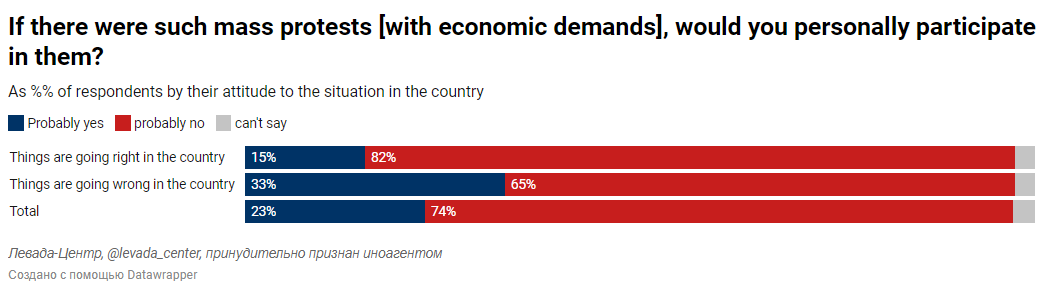
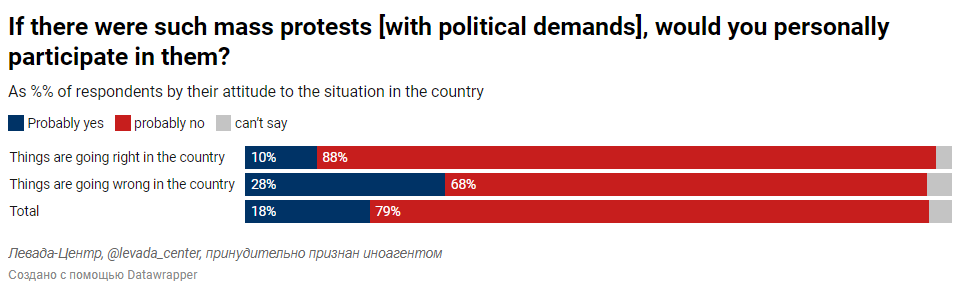
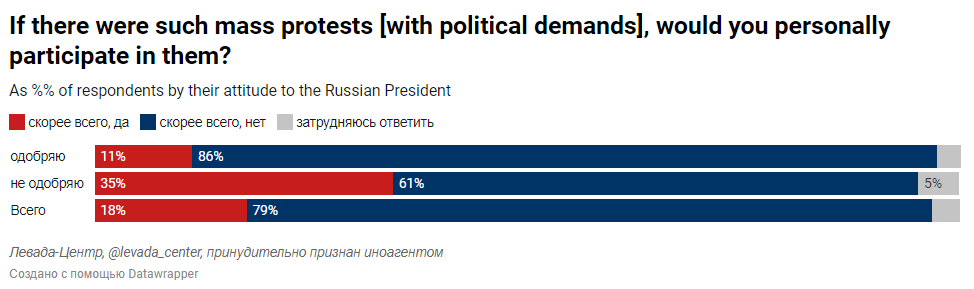
In mid-February, 29% of Russians considered protests with economic demands possible, 23% were ready to take part in them. Mass demonstrations with political demands were considered possible by 29% of respondents, while 18% were ready to participate in them. The most protesting groups were low-income respondents, those who believe that the country is moving in the wrong direction, and those who disapprove of the president’s activities. The survey was conducted on February 17-21.
The number of Russians expecting protests with economic demands in mid-February has hardly changed compared to the end of autumn 2021: in November 2021, 30% of respondents considered these protests possible, in February this year — 29%. At the same time, the willingness to participate in such protests increased slightly: 21% in November 2021, 23% in February 2022.
Потенциал протеста с экономическими требованиями
| Вполне возможны* |
| Приняли бы участие** |
| 05.1994 | 06.1994 | 07.1994 | 08.1994 | 09.1994 | 11.1994 | 01.1995 | 03.1995 | 05.1995 | 07.1995 | 09.1995 | 11.1995 | 01.1996 | 03.1996 | 05.1996 | 07.1996 | 09.1996 | 11.1996 | 01.1997 | 03.1997 | 05.1997 | 07.1997 | 09.1997 | 11.1997 | 01.1998 | 03.1998 | 05.1998 | 07.1998 | 09.1998 | 11.1998 | 01.1999 | 03.1999 | 05.1999 | 07.1999 | 09.1999 | 11.1999 | 01.2000 | 03.2000 | 05.2000 | 07.2000 | 09.2000 | 11.2000 | 01.2001 | 03.2001 | 05.2001 | 07.2001 | 09.2001 | 11.2001 | 01.2002 | 03.2002 | 05.2002 | 07.2002 | 09.2002 | 11.2002 | 01.2003 | 03.2003 | 05.2003 | 07.2003 | 09.2003 | 11.2003 | 01.2004 | 03.2004 | 05.2004 | 07.2004 | 09.2004 | 11.2004 | 01.2005 | 03.2005 | 05.2005 | 07.2005 | 09.2005 | 11.2005 | 01.2006 | 03.2006 | 05.2006 | 07.2006 | 09.2006 | 11.2006 | 01.2007 | 03.2007 | 05.2007 | 07.2007 | 09.2007 | 11.2007 | 01.2008 | 03.2008 | 09.2008 | 12.2008 | 02.2009 | 03.2009 | 06.2009 | 08.2009 | 10.2009 | 12.2009 | 02.2010 | 04.2010 | 05.2010 | 08.2010 | 10.2010 | 12.2010 | 02.2011 | 04.2011 | 06.2011 | 08.2011 | 10.2011 | 12.2011 | 02.2012 | 04.2012 | 06.2012 | 08.2012 | 10.2012 | 12.2012 | 02.2013 | 04.2013 | 06.2013 | 08.2013 | 02.2014 | 04.2014 | 06.2014 | 08.2014 | 10.2014 | 12.2014 | 02.2015 | 04.2015 | 06.2015 | 08.2015 | 10.2015 | 12.2015 | 02.2016 | 04.2016 | 08.2016 | 10.2016 | 12.2016 | 02.2017 | 04.2017 | 06.2017 | 09.2017 | 12.2017 | 03.2018 | 07.2018 | 11.2018 | 02.2019 | 05.2019 | 08.2019 | 11.2019 | 02.2020 | 05.2020 | 07.2020 | 11.2020 | 01.2021 | 05.2021 | 08.2021 | 11.2021 | 02.2022 | 05.2022 | 08.2022 | 11.2022 | 03.2023 | 06.2023 | 09.2023 | 01.2024 | 07.2024 | 12.2024 | 04.2025 | 11.2025 | 04.2026 |
| 33 | 31 | 25 | 27 | 26 | 27 | 27 | 30 | 27 | 27 | 27 | 26 | 23 | 25 | 24 | 21 | 28 | 40 | 30 | 45 | 40 | 35 | 29 | 29 | 31 | 34 | 43 | 40 | 48 | 43 | 36 | 37 | 31 | 32 | 28 | 23 | 18 | 21 | 16 | 19 | 19 | 20 | 17 | 23 | 21 | 17 | 15 | 20 | 16 | 20 | 19 | 17 | 17 | 24 | 21 | 26 | 21 | 20 | 20 | 18 | 19 | 19 | 19 | 22 | 24 | 24 | 25 | 36 | 32 | 26 | 23 | 32 | 25 | 37 | 34 | 31 | 28 | 22 | 20 | 30 | 30 | 23 | 21 | 22 | 18 | 21 | 18 | 23 | 39 | 31 | 25 | 22 | 21 | 25 | 27 | 30 | 26 | 25 | 25 | 26 | 28 | 28 | 26 | 25 | 29 | 29 | 35 | 29 | 31 | 27 | 30 | 28 | 28 | 25 | 25 | 22 | 28 | 21 | 19 | 17 | 17 | 24 | 23 | 20 | 18 | 17 | 18 | 21 | 24 | 19 | 18 | 18 | 15 | 19 | 27 | 28 | 26 | 23 | 17 | 41 | 37 | 34 | 26 | 34 | 30 | 26 | 27 | 30 | 25 | 43 | 30 | 26 | 30 | 29 | 17 | 20 | 17 | 18 | 17 | 19 | 17 | 21 | 14 | 16 | 16 | 20 |
| 26 | 25 | 22 | 22 | 21 | 21 | 26 | 25 | 24 | 25 | 23 | 23 | 24 | 23 | 19 | 19 | 22 | 26 | 27 | 31 | 25 | 22 | 23 | 21 | 25 | 26 | 27 | 27 | 33 | 24 | 29 | 28 | 27 | 28 | 24 | 24 | 20 | 15 | 17 | 19 | 18 | 18 | 19 | 24 | 22 | 20 | 17 | 18 | 17 | 20 | 21 | 18 | 20 | 20 | 24 | 26 | 22 | 22 | 19 | 17 | 22 | 19 | 21 | 22 | 22 | 23 | 27 | 27 | 24 | 22 | 22 | 16 | 23 | 26 | 23 | 25 | 25 | 19 | 22 | 25 | 23 | 20 | 22 | 17 | 18 | 22 | 18 | 20 | 23 | 26 | 18 | 18 | 16 | 17 | 20 | 20 | 17 | 18 | 20 | 21 | 19 | 23 | 23 | 21 | 19 | 19 | 17 | 16 | 17 | 17 | 13 | 14 | 17 | 17 | 16 | 16 | 14 | 14 | 15 | 8 | 12 | 14 | 12 | 15 | 10 | 13 | 11 | 13 | 16 | 11 | 12 | 12 | 12 | 12 | 16 | 15 | 14 | 13 | 8 | 28 | 30 | 26 | 27 | 27 | 25 | 24 | 28 | 29 | 23 | 17 | 21 | 24 | 21 | 23 | 14 | 16 | 15 | 16 | 15 | 18 | 11 | 22 | 13 | 13 | 17 | 16 |
The low-income groups of respondents are most prone to protest sentiment, as well as those believing the country is moving on the wrong path and those disapproving of the president’s policies. In mid-February, 29% of those who can barely afford food would most likely take part in potential protests with economic demands as well as 33% of those who believe that the country is moving on the wrong path and 39% of those who disapprove of the president’s activities.


The assessment of the potential of protests with political demands has increased: in November 2021, 27% of Russians considered them possible, in February 2022 – 29%. The willingness to participate in such protests has hardly changed: 17% would have participated in such protests last November, this February the number was 18%.
Потенциал протеста с политическими требованиями
До августа 2009 г. вопрос о готовности принять участие в протестах не задавался
| Вполне возможны* |
| Приняли бы участие** |
| 03.1997 | 05.1997 | 07.1997 | 09.1997 | 11.1997 | 01.1998 | 03.1998 | 05.1998 | 07.1998 | 09.1998 | 11.1998 | 01.1999 | 03.1999 | 05.1999 | 07.1999 | 09.1999 | 11.1999 | 01.2000 | 03.2000 | 05.2000 | 07.2000 | 09.2000 | 11.2000 | 01.2001 | 03.2001 | 05.2001 | 07.2001 | 09.2001 | 10.2001 | 11.2001 | 01.2002 | 03.2002 | 05.2002 | 07.2002 | 09.2002 | 01.2003 | 03.2003 | 05.2003 | 07.2003 | 09.2003 | 11.2003 | 01.2004 | 03.2004 | 05.2004 | 07.2004 | 09.2004 | 11.2004 | 01.2005 | 03.2005 | 05.2005 | 07.2005 | 09.2005 | 11.2005 | 01.2006 | 03.2006 | 05.2006 | 07.2006 | 09.2006 | 11.2006 | 01.2007 | 03.2007 | 05.2007 | 07.2007 | 09.2007 | 11.2007 | 01.2008 | 03.2008 | 09.2008 | 08.2009 | 10.2009 | 12.2009 | 02.2010 | 04.2010 | 06.2010 | 08.2010 | 10.2010 | 12.2010 | 02.2011 | 04.2011 | 06.2011 | 08.2011 | 10.2011 | 12.2011 | 02.2012 | 04.2012 | 06.2012 | 08.2012 | 10.2012 | 12.2012 | 02.2013 | 04.2013 | 06.2013 | 08.2013 | 10.2013 | 12.2013 | 02.2014 | 04.2014 | 06.2014 | 08.2014 | 10.2014 | 12.2014 | 02.2015 | 04.2015 | 06.2015 | 08.2015 | 10.2015 | 12.2015 | 02.2016 | 04.2016 | 08.2016 | 10.2016 | 12.2016 | 02.2017 | 04.2017 | 06.2017 | 09.2017 | 12.2017 | 03.2018 | 07.2018 | 11.2018 | 02.2019 | 05.2019 | 08.2019 | 11.2019 | 02.2020 | 11.2020 | 01.2021 | 05.2021 | 08.2021 | 11.2021 | 02.2022 | 05.2022 | 08.2022 | 11.2022 | 03.2023 | 06.2023 | 09.2023 | 01.2024 | 07.2024 | 12.2024 | 04.2025 | 11.2025 | 04.2026 |
| 41 | 37 | 36 | 28 | 32 | 31 | 32 | 37 | 40 | 49 | 50 | 38 | 39 | 37 | 37 | 32 | 25 | 16 | 15 | 12 | 14 | 15 | 13 | 13 | 24 | 20 | 19 | 17 | 20 | 20 | 17 | 19 | 18 | 18 | 16 | 20 | 22 | 21 | 21 | 20 | 18 | 18 | 17 | 18 | 20 | 21 | 21 | 21 | 27 | 28 | 22 | 19 | 24 | 24 | 24 | 23 | 22 | 22 | 20 | 16 | 28 | 20 | 18 | 18 | 18 | 16 | 16 | 13 | 17 | 15 | 18 | 20 | 22 | 22 | 20 | 19 | 20 | 23 | 21 | 19 | 20 | 23 | 26 | 33 | 26 | 24 | 23 | 24 | 22 | 21 | 22 | 21 | 19 | 26 | 18 | 23 | 17 | 14 | 12 | 12 | 16 | 16 | 15 | 14 | 15 | 14 | 17 | 18 | 15 | 15 | 14 | 12 | 14 | 23 | 23 | 21 | 19 | 12 | 34 | 30 | 28 | 24 | 30 | 29 | 24 | 23 | 45 | 28 | 27 | 27 | 29 | 16 | 17 | 17 | 16 | 17 | 14 | 15 | 15 | 10 | 12 | 11 | 14 |
| 13 | 9 | 11 | 13 | 14 | 13 | 12 | 13 | 13 | 13 | 19 | 11 | 15 | 15 | 17 | 14 | 12 | 11 | 11 | 11 | 11 | 12 | 12 | 11 | 10 | 14 | 9 | 10 | 10 | 9 | 7 | 8 | 9 | 10 | 11 | 8 | 10 | 8 | 10 | 12 | 8 | 10 | 10 | 9 | 8 | 13 | 12 | 11 | 8 | 6 | 23 | 22 | 20 | 22 | 20 | 19 | 19 | 19 | 15 | 16 | 19 | 17 | 18 | 9 | 11 | 12 | 12 | 10 | 13 | 8 | 13 | 8 | 8 | 11 | 12 |
Similar to mass protests with economic demands, low-income respondents (21% of those who barelycan afford food), as well as those who believe that the country is moving in the wrong direction (28%)as well as those who disapprove of the president’s activities (35%) were most ready for protests with political demands in mid-February.

METHODOLOGY
METHODOLOGY
The survey by the Levada Center was conducted January 17 – February 21, among a representative sample of all Russian urban and rural residents. The sample was comprised of 1626 people aged 18 or older in 137 municipalities of 50 regions of the Russian Federation. The survey was conducted as a personal interview in respondents’ homes. The answer distribution is presented as percentages of the total number of participants along with data from previous surveys.
The statistical error of these studies for a sample of 1600 people (with a probability of 0.95) does not exceed:
3.4% for indicators around 50%
2.9% for indicators around 25%/75%
2.0% for indicators around 10%/90%
1.5% for indicators around 5%/95%
The ANO Levada Center is included in the registry of non-commercial organizations acting as foreign agents.